I've shown elsewhere that the first lockdown did not work. Infections were declining; the peak of infections had passed and the lockdown was therefore not necessary to suppress them. Would lockdown have worked if it had been imposed sooner? With the information available at the time would it have made sense to order a curfew or other non-pharmaceutical intervention (such as selective or general border closures, mask mandates, 'health passports' etc) earlier, and if so, when?
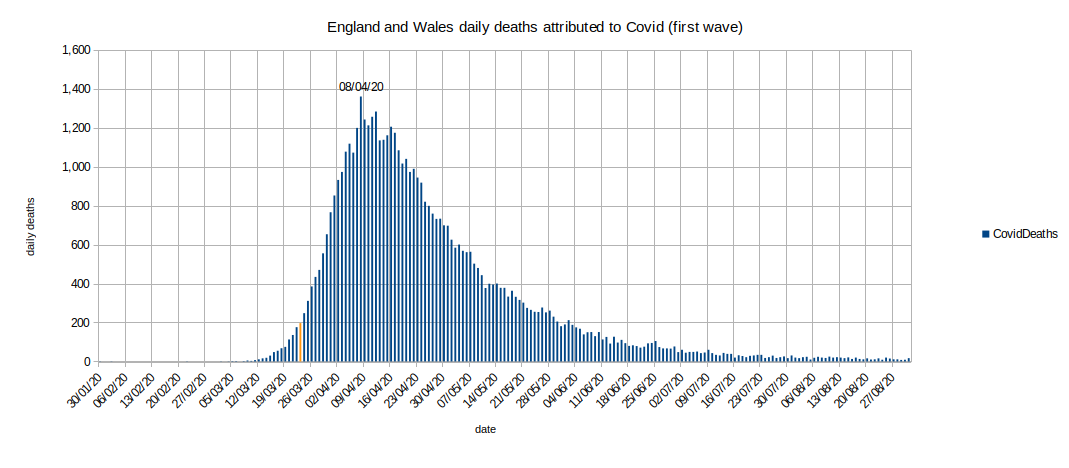
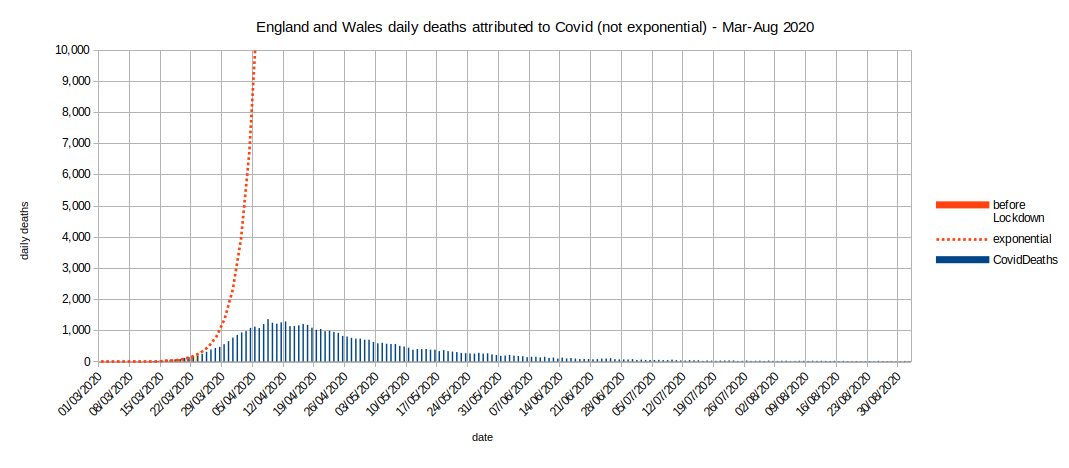
We're all too familiar with the above chart. It's the daily death count by date of death of the first wave of Covid in England and Wales where Covid was mentioned as a cause of death on the death certificate. The day marked orange is when the first curfew (lockdown) was announced. We know what it looks like now, but what did it look like in the early days of the epidemic?
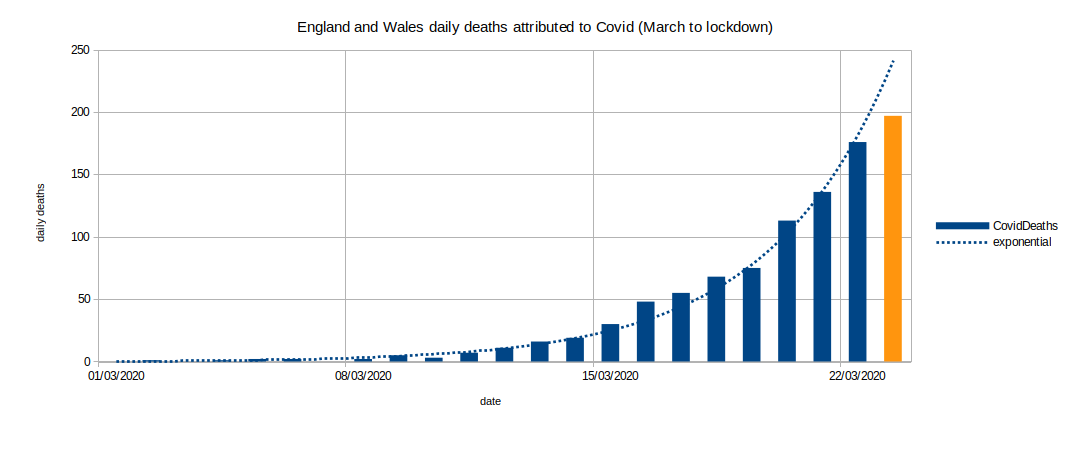
It looks scary. A chart of daily death count from the beginning of March to the lockdown announcement looks a bit like an exponential curve. It's not actually exponential, of course - epidemics never are.
Just how fast was this really changing? A common method to assess how fast something is changing is to measure differences over time. So to assess speed we measure difference in distance from the start point over duration (eg, metres per second, or miles per hour). We measure acceleration as a difference (increase) in speed over time (eg zero to 60mph in 10sec, or 10 metres per second per second (that last one is 1G or the acceleration of a falling object on Earth)). To measure the speed of spread of an epidemic we might want to measure how many more people are infected each day (difference in infections per day). However, we can never acheive this unless we can reliably test everyone each day (we didn't have a rapid Covid test generally available in the UK until December 2020, and there are questions over its sensitivity); we need a surrogate measure - something we can measure which is directly related to what we want to know. Instead we might measure the difference in daily death count each day (eg, how many more deaths on a given day divided by the number of deaths the day before to give a percentage increase for each day) and use this to retrospectively indicate the spread of infections some time before. Using this approach we can calculate that Covid deaths on 23 Mar 2020 were about 12% higher than the day before (197 deaths on 23 Mar 2020, 176 deaths on 22 Mar 2020, (197-176)/176 = 11.9% change) and so on for each day (a true exponential would have a fixed percentage change for each day eg 'each day is 12% more than the previous day').
| DeathDate | CovidDeaths | % change |
|---|---|---|
| 02/03/2020 | 1 | ∞ |
| 03/03/2020 | 0 | -100.00% |
| 04/03/2020 | 1 | ∞ |
| 05/03/2020 | 2 | 100.00% |
| 06/03/2020 | 2 | 0.00% |
| 07/03/2020 | 0 | -100.00% |
| 08/03/2020 | 2 | ∞ |
| 09/03/2020 | 5 | 150.00% |
| 10/03/2020 | 3 | -40.00% |
| 11/03/2020 | 7 | 133.33% |
| 12/03/2020 | 11 | 57.14% |
| 13/03/2020 | 16 | 45.45% |
| 14/03/2020 | 19 | 18.75% |
| 15/03/2020 | 30 | 57.89% |
| 16/03/2020 | 48 | 60.00% |
| 17/03/2020 | 55 | 14.58% |
| 18/03/2020 | 68 | 23.64% |
| 19/03/2020 | 75 | 10.29% |
| 20/03/2020 | 113 | 50.67% |
| 21/03/2020 | 136 | 20.35% |
| 22/03/2020 | 176 | 29.41% |
| 23/03/2020 | 197 | 11.93% |
The number of deaths is increasing each day, but certainly not by a fixed percentage, and the amount it's increasing by seems to be getting less over time. If this continues then we'll reach some point when the change is negative ie when there are fewer deaths than the day before.
We have a problem here: an infinite increase is meaningless - it gives us no useful information. This sort of problem often occurs when analysing data with very low counts (the data is 'spiky'), very small changes show as very large effects. There's another problem: if a victim dies just before or just after midnight the date of death can be a matter of chance; with very low death counts at the beginning of an epidemic this can result in zero deaths being recorded for a day and that will result in an 'infinity' in the calculations.
One well known method to smooth out spiky data is to use a 3-day (or more) centred average... But what would that do to the larger scale picture?
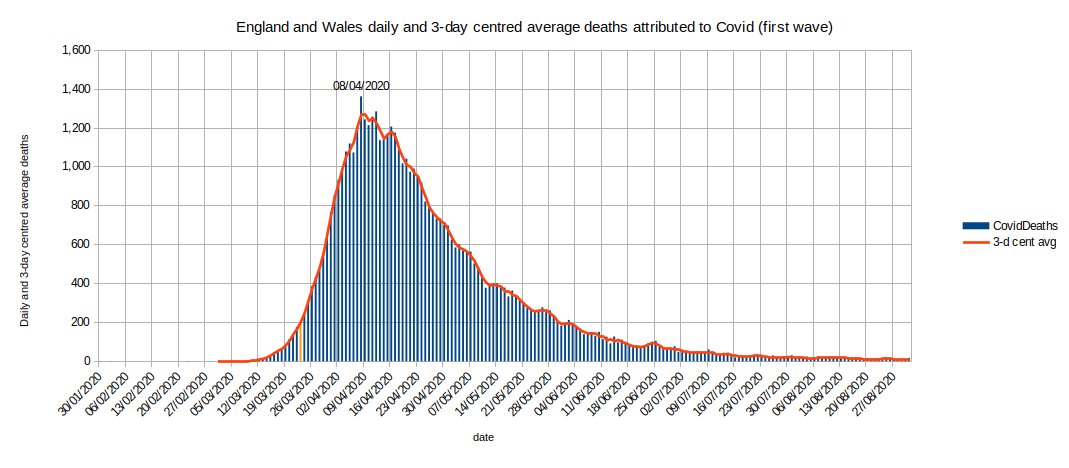
No, no significant difference in the large-scale picture.
| DeathDate | CovidDeaths | 3-day centred average |
% change | % 3-day centred average change |
|---|---|---|---|---|
| 02/03/2020 | 1 | 0.33 | ∞ | ∞ |
| 03/03/2020 | 0 | 0.67 | -100.00% | 100.00% |
| 04/03/2020 | 1 | 1.00 | ∞ | 50.00% |
| 05/03/2020 | 2 | 1.67 | 100.00% | 66.67% |
| 06/03/2020 | 2 | 1.33 | 0.00% | -20.00% |
| 07/03/2020 | 0 | 1.33 | -100.00% | 0.00% |
| 08/03/2020 | 2 | 2.33 | ∞ | 75.00% |
| 09/03/2020 | 5 | 3.33 | 150.00% | 42.86% |
| 10/03/2020 | 3 | 5.00 | -40.00% | 50.00% |
| 11/03/2020 | 7 | 7.00 | 133.33% | 40.00% |
| 12/03/2020 | 11 | 11.33 | 57.14% | 61.90% |
| 13/03/2020 | 16 | 15.33 | 45.45% | 35.29% |
| 14/03/2020 | 19 | 21.67 | 18.75% | 41.30% |
| 15/03/2020 | 30 | 32.33 | 57.89% | 49.23% |
| 16/03/2020 | 48 | 44.33 | 60.00% | 37.11% |
| 17/03/2020 | 55 | 57.00 | 14.58% | 28.57% |
| 18/03/2020 | 68 | 66.00 | 23.64% | 15.79% |
| 19/03/2020 | 75 | 85.33 | 10.29% | 29.29% |
| 20/03/2020 | 113 | 108.00 | 50.67% | 26.56% |
| 21/03/2020 | 136 | 141.67 | 20.35% | 31.17% |
| 22/03/2020 | 176 | 169.67 | 29.41% | 19.76% |
| 23/03/2020 | 197 | 207.00 | 11.93% | 22.00% |
That's better. We've got rid of the pesky infinities. We had better compare the smoothed data with reality for 1 March to the lockdown date to see if we've changed the small scale picture.
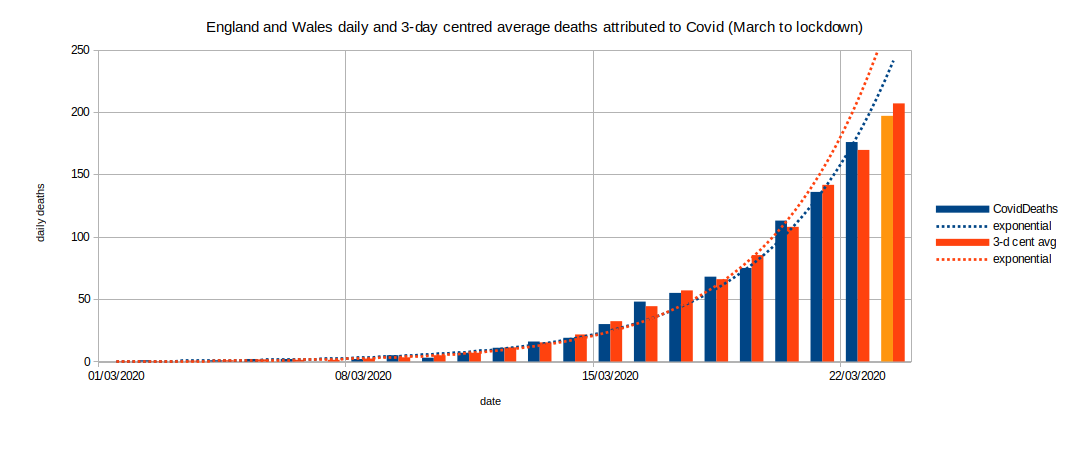
The only significant change to the picture is that the 'best fit' exponential looks even less likely to be true.
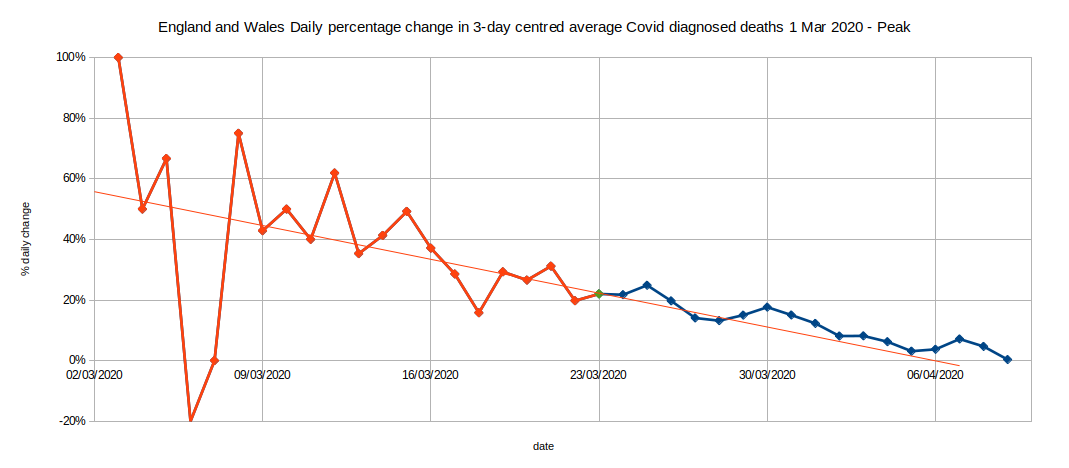
Since we know it's not exponential (not increasing by a consistent amount each day) we should now look to see how the percentage changes to the 3-day average are changing over time and if there's a trend to that change.
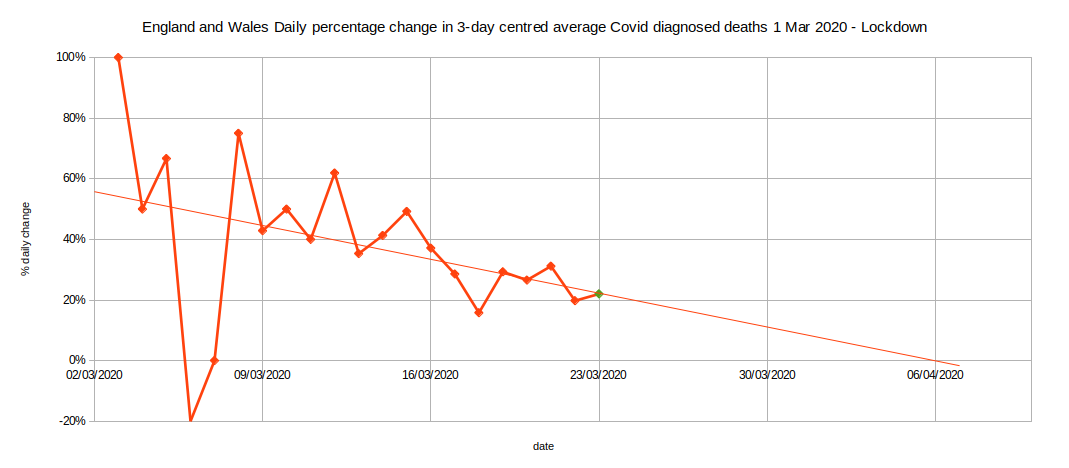
Well look at that: There is a trend - and its a reducing trend. Because we're measuring percentage change in daily deaths, when/if the changes fall to 0% we will have reached a peak in death rate - and the fall in death rate that must follow the peak. The trend in 3-day centred average Covid diagosed death data from March to lockdown predicted (using this straight line method) that the peak would occur on 6 Apr 2020. With the benefit of hindsight we know that it didn't; the peak was on 8 Apr 2020 (1,360 deaths in England and Wales), but that's impressively close.
Think about it: the trend in death data before lockdown correctly showed that the peak in deaths would occur in early April. This means the trend in infections leading to the peak and subsequent decline in deaths was already set well before the lockdown announcement. In order to reduce or delay the peak in deaths, some of those infections would have to be prevented or delayed.
So when did the infections which lead to peak deaths occur? If we wanted to reduce or delay those, when should we have intervened - and in what way?
There's a hint in the data that the average lead time between infection and death for those who died was 27 days (about 4 weeks). The peak of deaths was on 8 Apr 2020. Therefore the peak of infections was probably around 12 Mar 2020. If a curfew was to be effective, it would have to have been imposed well before that date. Given that 1,360 people died on 8 April, and if the infection fatality rate was as high as 1%, that would mean 136,000 people were infected on or around 12 March (and a slightly smaller number the day before, and so on). Intervening after 12 March would not have stopped those people being infected and a proportion of them dying. So would intervening a week before (5 Mar 2020) have helped? By 5 Mar there had been 2 Covid deaths in GB (both of them in England) but none had actually been registered by then. Imagine: 'I'm sorry to announce that we're expecting some deaths - I'm imposing a lockdown'.
But how many deaths were we expecting and by when?
In very early March the UK government was already in thrall to the advice emanating from Imperial College London. It seems the government were being selective about what advice they were listening to.
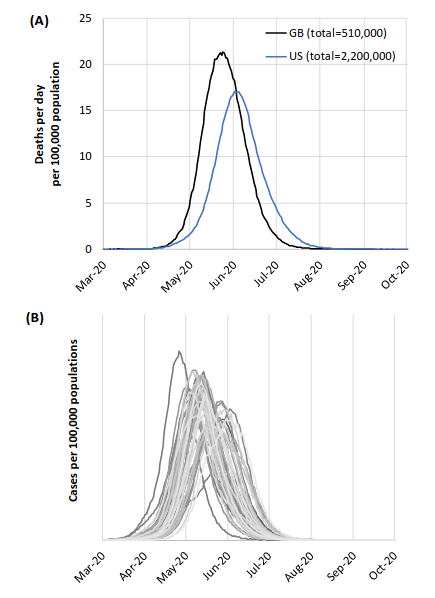
'Report 9', the Imperial College London paper famous for forecasting half a million deaths, was published on 16 Mar 2020 (4 days after the above estimated peak in infections). In other words, too late to have any effect on the peak. The 'Results' section (page 6) opens with this paragraph:
In the (unlikely) absence of any control measures or spontaneous changes in individual behaviour, we would expect a peak in mortality (daily deaths) to occur after approximately 3 months (Figure 1A). In such scenarios, given an estimated R0 of 2.4, we predict 81% of the GB and US populations would be infected over the course of the epidemic. Epidemic timings are approximate given the limitations of surveillance data in both countries: The epidemic is predicted to be broader in the US than in GB and to peak slightly later. This is due to the larger geographic scale of the US, resulting in more distinct localised epidemics across states (Figure 1B) than seen across GB. The higher peak in mortality in GB is due to the smaller size of the country and its older population compared with the US. In total, in an unmitigated epidemic, we would predict approximately 510,000 deaths in GB and 2.2 million in the US, not accounting for the potential negative effects of health systems being overwhelmed on mortality.
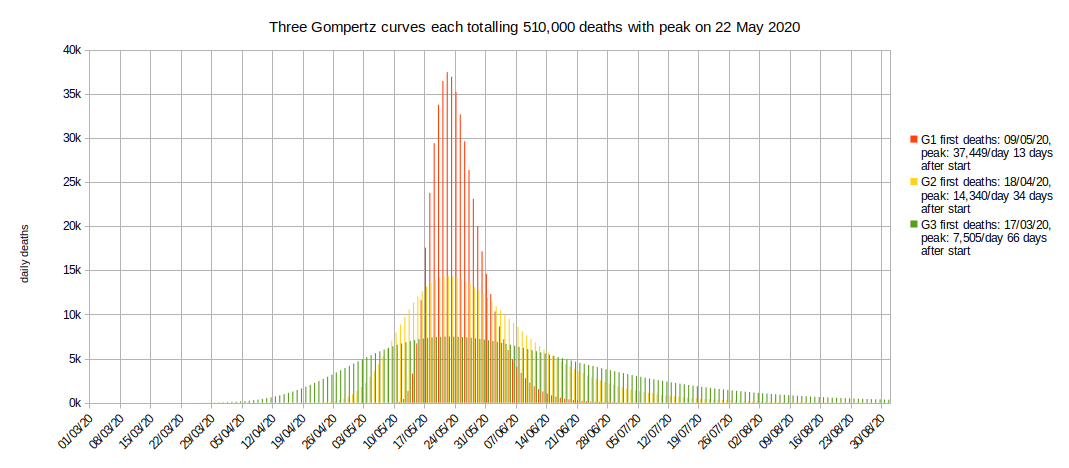
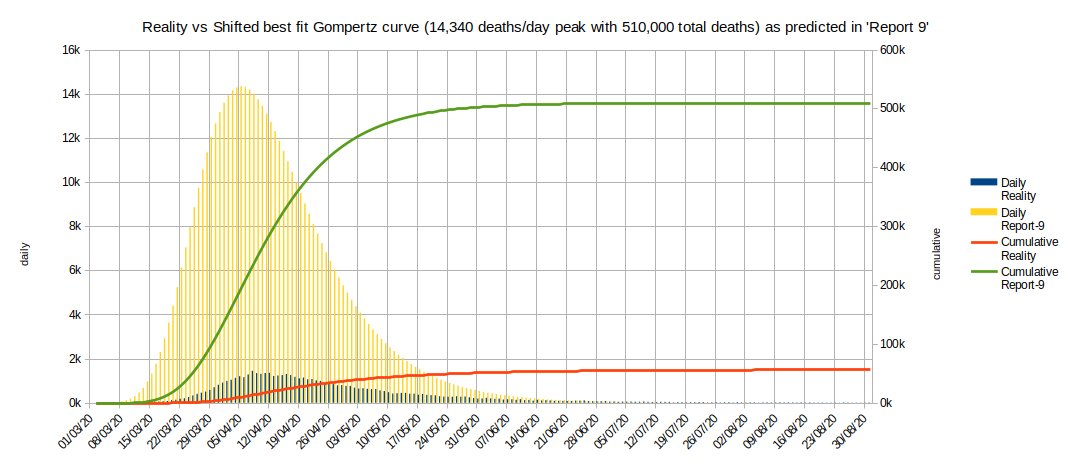
At the start of the first lockdown in the UK we were bombarded with the message that we had to 'Stay at home. Protect the NHS. Save lives.' ie take action to make the progress of the epidemic 'low and wide' (as in the example of the three Gompertz curves above) in order to prevent the daily rate of new infections overwhelming the health service (my paraphrasing). However, lockdown could not have averted the majority of infections which led to the peak in deaths on 8 Apr 2020 as most of those victims had been infected in early March.
The straight line trend in changes to death rates from early March to lockdown during the first wave of the epidemic in England and Wales pointed to the peak daily death rate occurring in early April, which is what actually happened. If we assumed the death toll was going to follow a Gompertz curve the data up to 23 Mar 2020 also forecast a peak in early April and a total death count of 36,250 by 31 Aug 2020. About 4 days late with the peak and 30% low on the total - but a lot closer to reality than the insane predictions in 'Report 9'.
By mid-March the trend in death data was already indicating an early April peak. To alter this, any intervention would have to have averted the infections leading to those deaths. In other words, lockdown (if it was effective) would have to have started in mid-February. By mid-February 'Report 9' had not been published and there had been two deaths attributed to Covid in England and Wales; I doubt that Parliament would have granted the Government the curfew powers based on the available evidence.
I'm pleased to say that, unlike in many other states, the UK Government normally has very limited powers to order a curfew. In order to impose 'lockdown' (and all the other changes to tax, benefits, furlough, employment, contact tracing, social distancing, tenancy protection, border controls and infection and death registration and everything else that came with it) the Government had to persuade Parliament to approve the Coronavirus Act 2020 (342 printed pages). This Bill was given its First Reading on 19 Mar 2020 (three days after 'Report 9' was published) and was passed without Division (Parliament did not vote on it, it went through without any MP calling for a vote) and received Royal Assent (became law) on 25 Mar 2020 - though the curfew was actually announced two days before it became law. The Opposition party leader had previously stated that his party would not seek to debate or make any ammendments to the Government's Bill; a source said that "...Labour was attempting to strike a balance between scrutinising government and facing up to the virus". The whole political establishment conspired to approve lockdown.
Lockdown on 23 Mar 2020 could not have affected the peak and subsequent decline in deaths as the infections which led to those deaths had occurred before lockdown. If it did not cause the decline in infections then it was not necessary; some other effect had already done it.
Note that there was, however, a very small (about 3.5%) short-term (for about 5 weeks) improvement in the death rate trend that started at around 19 Apr 2020 (about 11 days after the peak of deaths and about 4 weeks after lockdown) which may have been associated with the lockdown. That improvement was cancelled out over the following 9 weeks. There was no other improvement in the trend that could have been caused by the lockdown.
Much is said about the UK Government failing to heed the warning from what was happening in Italy. The following is from an article on Wikipedia extracted on 3 March 2022:
The virus was first confirmed to have spread to Italy on 31 January 2020, when two Chinese tourists in Rome tested positive for the virus. One week later an Italian man repatriated to Italy from the city of Wuhan, China, was hospitalized and confirmed as the third case in Italy. Clusters of cases were later detected in Lombardy and Veneto on 21 February, with the first deaths on 22 February. By the beginning of March, the virus had spread to all regions of Italy.
It appears that over a period of only about 3-4 weeks the virus spread throughout Italy. This thing was not going to be stopped by a curfew. Closing borders after it was already spreading within the United Kingdom would have been futile.
There was no warning available from what was happening in Italy until late February by which time the infection was well established in the UK. About two weeks later the infections which led to the peak period deaths in England and Wales were already occurring.
It's important to realise that although this analysis is based on death date and not death registration date, the death date and diagnosis information for each death would not have been available until it was actually registered. Delays in the certifying doctor's paperwork or elsewhere in the registration process would have resulted in delays to the data becoming available. It typically takes 5 days or so for a death to be registered - for example: by the date of publication of 'Report 9' we now know (from ONS publications) that there had been 150 diagnosed Covid deaths in England and Wales but only 16 had completed registration. We should hope that Government advisers and decision makers had access to more up-to-date information than the ONS weekly publications, but faster access to the data before each registration process was complete might well have introduced errors. The Coronavirus Act 2020 included specific measures to try to reduce death registration delays to a minimum.
We've seen what the chart of %change in the 3-day centred average death count from March up to lockdown looked like, and how it trends toward a peak in death rate in early April. But should our decision makers have dared to believe the trend would continue to a peak at around that time? Here's what the same data looked like right up to that peak:
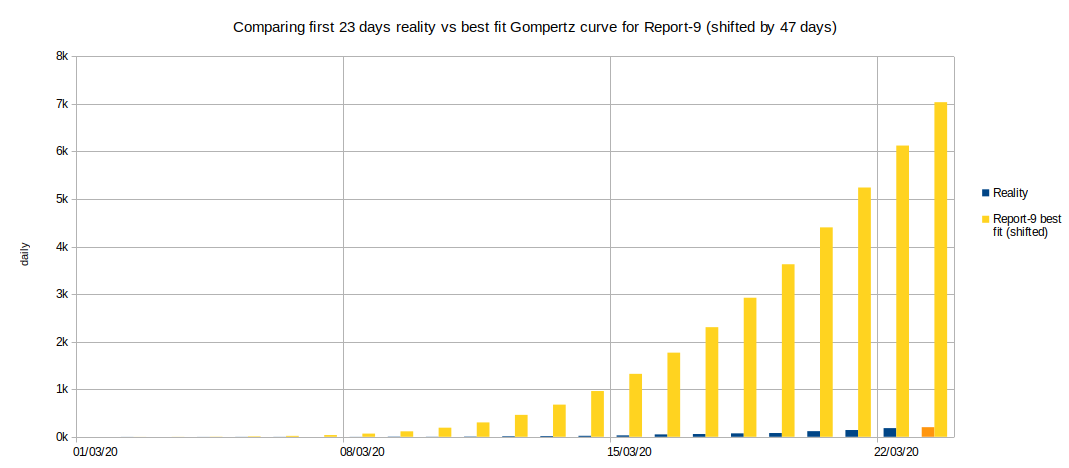
A very good match. Yes, it would have been a useful prediction - what other empirical evidence could they have relied on?
The UK Government should have realised before, or very soon after lockdown that the predictions in 'Report 9' were too high by a factor of ten and too late by many weeks. There was empirical evidence for this in the first few weeks of Covid death data but the government followed the guidance of epidemic computer modellers instead of the evidence. The Opposition party 'Shadow Cabinet' would have had access to the same data and reports as the Government and yet some called for harder and earlier lockdown - but I guess that's just the way of party politics. With the perspective of hindsight after the first wave and lockdown, why did the Government and Opposition and Regional government leaders push for and support the second and third lockdowns (on 5 Nov 2020 and 6 Jan 2021) when they should have known that the first lockdown had been ineffective and unnecessary?
Finally:
My answer to the question posed in the title of this post should now be obvious: No, lockdown was not too late. It should never have been tried. Having tried it once it should not have been tried the second and third times in the UK.
Many governments throughout the world followed curfew and similar socially and economically destructive policies. Maybe they have evidence that such policies were necessary or effective for their countries. If so, they should present that evidence. If not, their citizens should hold them (including any opposition parties) to account (obviously this can not apply in un-democratic countries).
Exponential:
It was never exponential. Saying or implying it could be or was exponential was and is foolish fear-mongering. This is what exponential looks like.

If you wish to comment you may email me at: SoundOfReason0 at gmail dot com. If I append your comment I will not publish your email address.