The question in the title raises other questions rather than pointing to answers. How should we measure if 'lockdown' etc has 'worked'? What do we mean by 'work'?
I suspect many people believe that prevention was the objective rather than delay. Different governments around the world may have had different objectives and may have changed objective part way through the course of the local epidemics. Early UK government messaging certainly emphasised delay rather than prevention but later emotive messages like 'don't kill Granny' seemed to signal a change in the approach.
This post draws on publicly available data which have been collated by the Human Mortality Database - Short-Term Mortality Fluctuations (STMF) and the Oxford University COVID-19 Government Response Tracker (OxCGRT) projects.
The Short-Term Mortality Fluctuations data is a collection of weekly mortality figures covering 38 countries around the world (including 'England and Wales', 'Scotland' and 'Northern Ireland' as three separate entries). The data are provided in a consistent format which helps allow comparisons between countries.
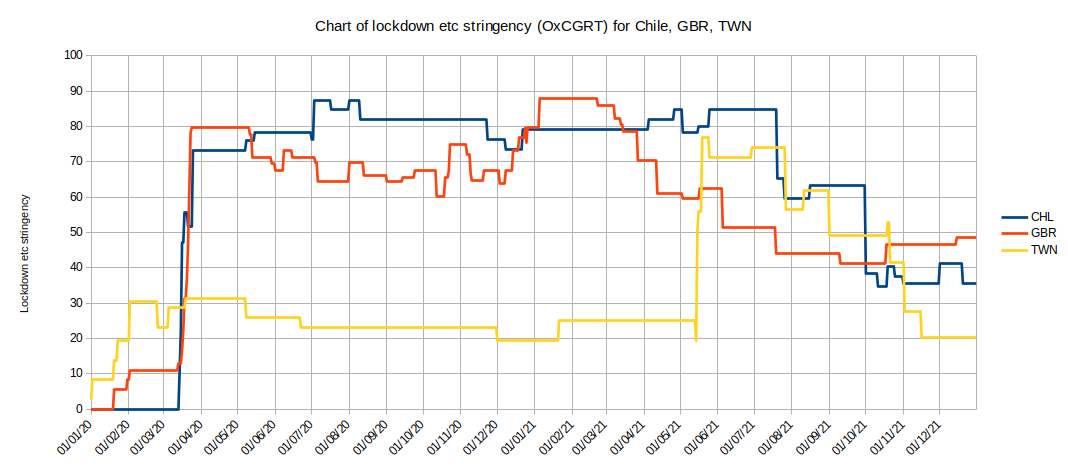
The COVID-19 Government Response Tracker is a collection of data concerning the dates of 'Lockdowns' and 'Quarantine' and other Non-Pharmaceutical Interventions (NPIs) imposed or recommended by governments of 186 countries around the world (eg closure of schools, places of worship, restaurants and bars, theatres, shops and offices, restrictions on social gathering, exercise, mask mandates and so on). It combines all interventions into a single 'stringency' index (or score) between 1-100 for each country for each day of the crisis. For example, if we plot the data for Chile, Great Britain and Taiwan we see this:
The stringency index is probably best explained by its inventors (see the link above). It does not aim to make value judgements between the different interventions - for example, a day of school closure is not necessarily twice (or half) the 'value' of a day of theatre closure - but they have aimed for consistency in the scoring between countries.
The mortality data is provided as death rate data for different age groups. From this we can calculate a single weekly age-standardised mortality rate (ASMR) and generate an 'expected' mortality baseline for each country from data prior to the pandemic (I've used 2010-2018 for the baseline where this is available, 9 years). We can then calculate the percentage difference between the mortality during the pandemic and the baseline mortality for each country (I've used 30 Dec 2019 to 2 Jan 2022, 2 years).
We can also easily calculate the average government interventions stringency score for all 38 countries over the same time period (eg a score of 70 for 184 days followed by a score of 60 for 185 days followed by a score of 50 for 184 days would give an average score of 60 over the whole period).
We can plot a 'scattergram' (x-y plot) of the average intervention stringency against percentage increase or decrease in mortality for the 38 countries we have both sets of data for. We can see if there's any correlation between these measures.
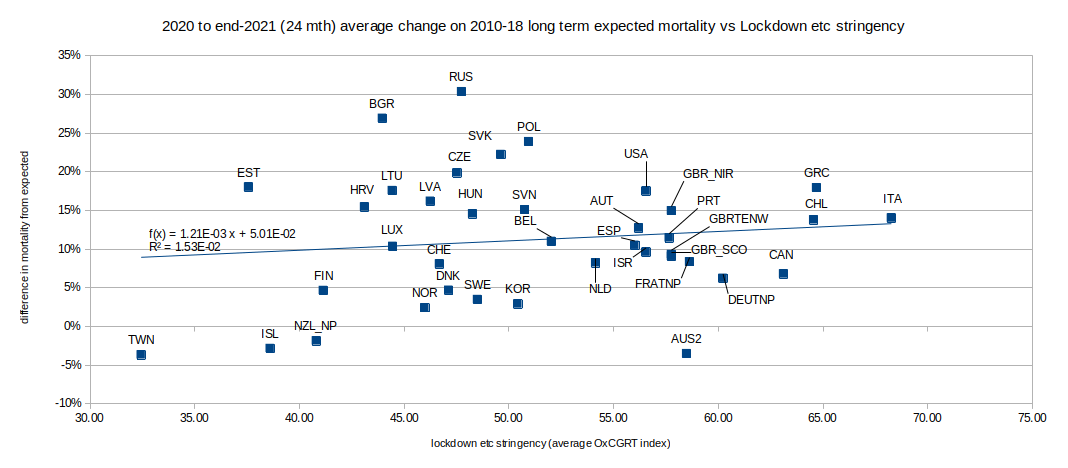
Yes, there is very weak correlation (R2 = 1.53%) - but not, perhaps, what we expected or hoped to see; it appears that the more stringent the interventions are the higher the mortality rate. We might have expected that tighter restrictions would result in lower mortality rates when comparing different countries.
As with many such things, the truth is probably somewhere between the extremes.
To tell the difference between the two extreme interpretations it may be possible to analyse the timing of changes in mortality against changes of intervention stringency for each country (in a way we've seen this for 'England and Wales' where the first lockdown appears to be associated with a slight, temporary slowing in mortality 27 days later). However, some countries imposed stringent lockdowns and maintained them until vaccines became ubiquitous (the government of Chile, for example, maintained a stringency score above 70 from mid-March 2020 to mid-July 2021 (16 months) and so did not have periods when lower stringency could be associated in time with increased mortality). To avoid getting bogged down in minutiae I think we'd better leave that analysis for another day - or another analyst.
If stringent interventions caused (some of) the increase in mortality then we need to confirm this as quickly as possible. I see this as the most important question for our Public Inquiries. If, instead, they focus on questions like 'Was public money wasted in the government response?' there will be little point to them and I can save them a lot of time: 'Yes. They were scared and in a hurry.' [Inquiry closed].
The chart shows that more stringent interventions, as assessed by the Oxford University team, did not decrease all-cause mortality. If stringent interventions were a reaction to increasing mortality or if the association between restrictions and mortality is a coincidence then it follows that differences in the change in mortality rate between countries were driven by something other than 'lockdown' stringency differences. For example, what explains the difference in mortality rate between (say) Norway (mortality: -1.05%, intervention score: 49.51) and Sweden (mortality: +4.13%, intervention score: 54.51)? Was it geography? population age or density distribution? wealth distribution? climate? genetics? availability and efficiency of health services? diet? trade? industry? pollution?, tourism? and so on ad infinitum.
Any interventions which aim to reduce (or delay) infections must have a lead time before their effect (if any) could appear in the death statistics. If these interventions were imposed as a reaction to rising death rates (bear in mind that in the first wave of the pandemic testing was not widely available) then we should expect to see mortality continue to rise for some time after lockdown - as indeed we do. The key question is would the death rates have continued to rise if lockdown had not been imposed?
One possibility is that the Oxford University index is not a good measure of lockdown stringency. If that is the case then we still do not have
But what about the success or otherwise in delaying the spread of the virus and flattening the curve? The height of the mortality peak in a country would be a good indicator to how close the local health care provision came to being overwhelmed.
So the objective might be to slow down the rate of infections so that the later severe illness and resulting death rate is kept within limits that the health services can cope with. We can test this by comparing how successfully the restrictions limited the height of the peak for each country.
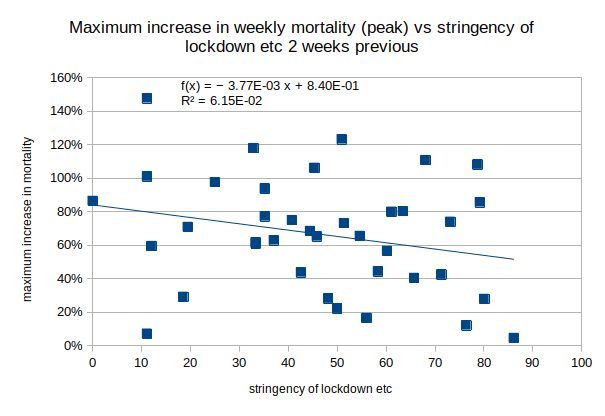
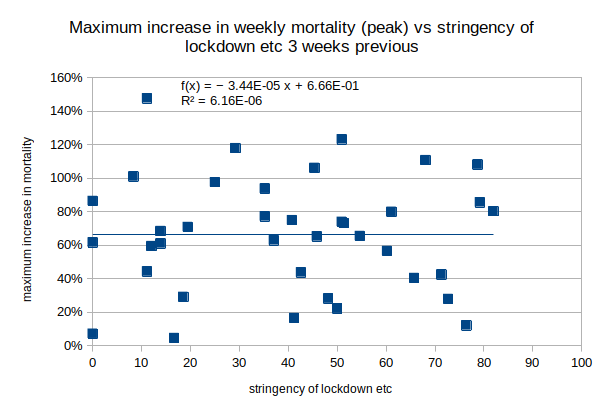
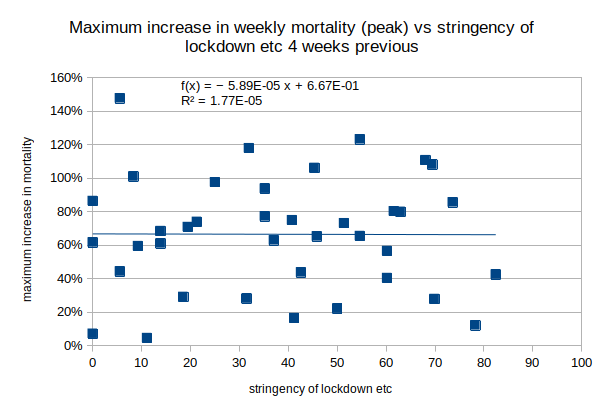
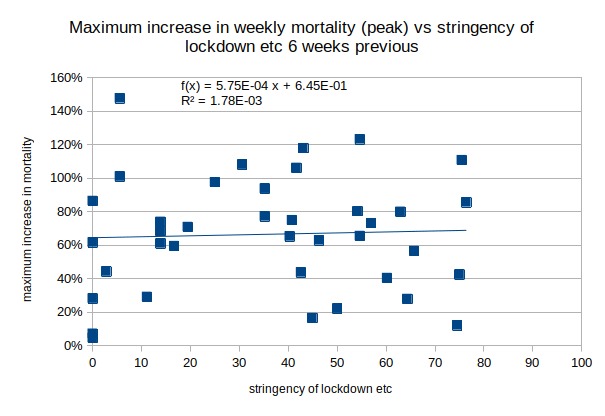
For each country we need to look at how much higher than the baseline the peak mortality rate was in percentage terms and how stringent the restrictions were when the infections leading to those deaths were taking place. As mentioned above there is a possible indication in other data that infection to death (for those who died) took an average of 27 days (~4 weeks) so we should look at the level of restrictions 4 or more weeks before each peak in mortality.
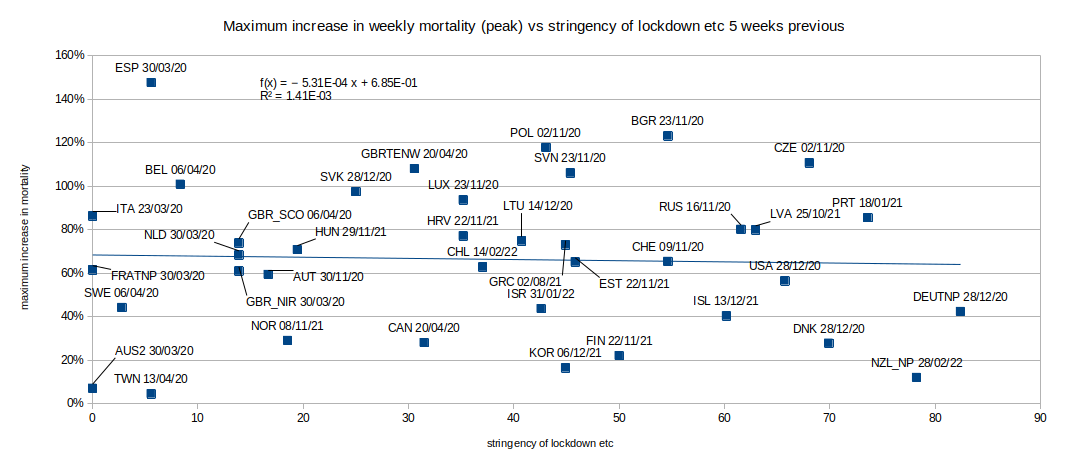
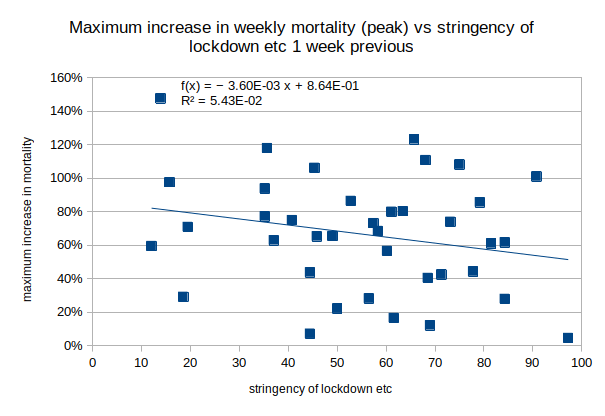
There is a weak (R2 = 5.43%, 6.15%) negative (good) correlation between the height of the peak above baseline in each country and the stringency of lockdown etc 1 or 2 weeks earlier, the correlation is stronger than the 2-year average correlation above. This is consistent with greater restrictions being imposed as mortality rises but it is too short a period for the effect to be due to increased restrictions leading to fewer infections leading to fewer deaths. There is no significant association (R2 < 0.2%) between the height of the peak in mortality and the level of restrictions 3 to 6 weeks prior to the peak in the 38 countries. The chart above shows the lack of correlation between the height (and date) of the mortality peak in each country and the level of restrictions in force 5-weeks previously (I have not tested 7 weeks earlier or more). The restrictions therefore did not flatten the curve and so cannot be said to have 'worked' in this respect.
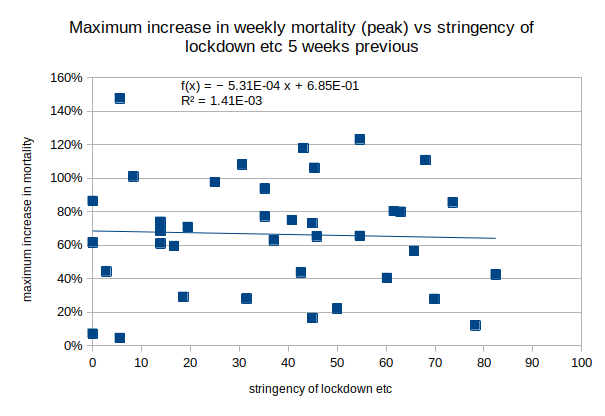
The observed weak, positive (bad), correlation between average intervention stringency and all-cause mortality, the lack of clarity on what may have caused the differences in mortality between countries and the lack of association between restrictions and peak mortality levels support the position that interventions had no useful effect in the 38 countries for which we have mortality data.
This analysis is based on observed all-cause mortality in each country between the beginning of 2020 and end of 2021 (compared with the country's 2010-18 weekly average) rather than any diagnosed cause of death. It is not based on Covid 'case numbers' or any other number that might be subject to shades of interpretation. The only diagnosis opinion involved is whether each person is dead or not.

If you wish to comment you may email me at: SoundOfReason0 at gmail dot com. If I append your comment I will not publish your email address.